Demo
Step Thru
Step Thru
This page provides screen shots of CDS-OPTIM cycling through its profit mining/maximation iterations.
These demos assume the viewer has knowledge of the Mail Channel White Paper and 'Scored Files'.
'Demo' mode provides a quick view of OPTIM's profit mining/improvement. 'StepThru' mode allows the
user to navigate back and forth through the iterations and notes for a fuller understanding of OPTIM.
These demos assume the viewer has knowledge of the Mail Channel White Paper and 'Scored Files'.
'Demo' mode provides a quick view of OPTIM's profit mining/improvement. 'StepThru' mode allows the
user to navigate back and forth through the iterations and notes for a fuller understanding of OPTIM.
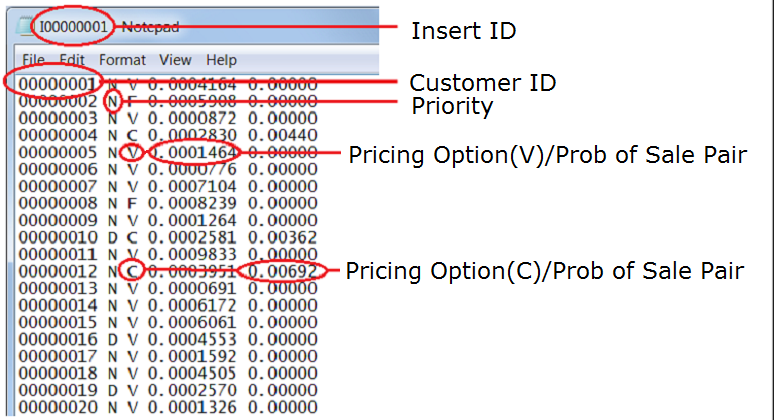
As mentioned previously, these pages assume the viewer is familiar with the Mail Channel White Paper. This page is
only meant to refresh the viewer's memory as to how a Marketer provides OPTIM with a rich body of information
through 'Scored Files' that enables OPTIM to formulate, in a variety of ways, customer specific offer prices for
OPTIM to consider. OPTIM will import a large number of these 'building block' files in order to maximize profit.
Click on the 'DEMO' button to begin the demo.

As a prepatory step, management decides which of the marketer inserts will be able to compete for inclusion in
customer mail pieces for a daily producton run. 'Scored Files'are either placed in the 'ScoredFiles' directory and
eligible for inclusion or moved to the 'bullpen' directory and excluded from a run but available for possible future use.
customer mail pieces for a daily producton run. 'Scored Files'are either placed in the 'ScoredFiles' directory and
eligible for inclusion or moved to the 'bullpen' directory and excluded from a run but available for possible future use.
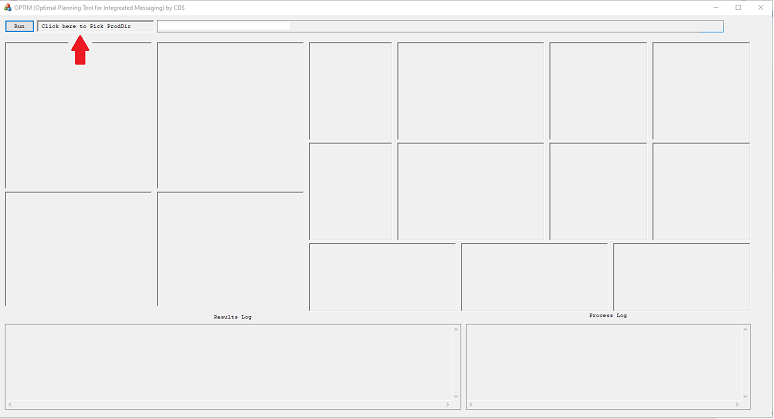
A click on OPTIM's desktop icon launches the application wherein the user clicks upon the 'Directory Finder'
to search for a daily production directory to be processed.
to search for a daily production directory to be processed.
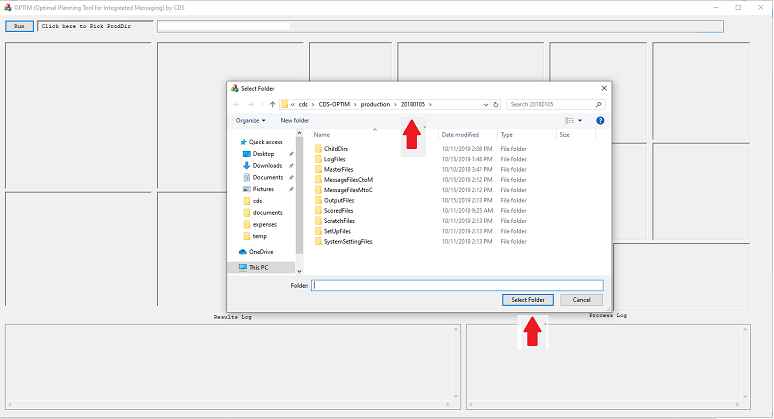
In this shot the user has found a daily production directory and is presented with the option of selecting it.
When he does, the OPTIM dashboard is displayed (next slide) and ready to begin processing.
When he does, the OPTIM dashboard is displayed (next slide) and ready to begin processing.
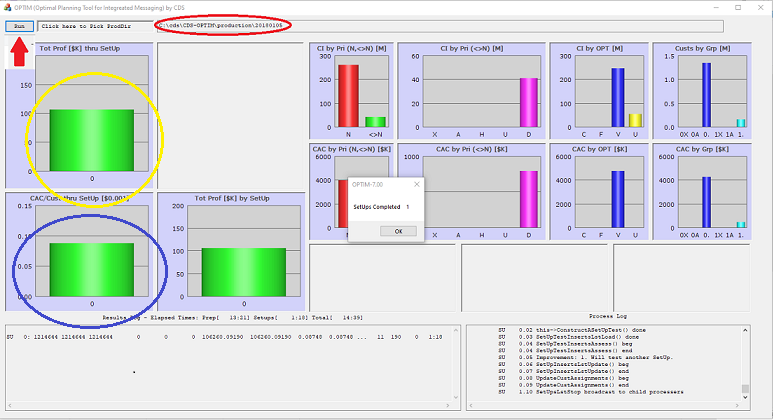
This shows the results of the first iteration (after a user has selected a daily production directory and clicked 'RUN').
Many real-time charts are updated each iteration but for now just focus on the ones on the left:
1. Total Profit (circled in yellow)
2. Revenue Per Assigned Recipient (circled in blue)
Click 'DEMO' to continue.
Many real-time charts are updated each iteration but for now just focus on the ones on the left:
1. Total Profit (circled in yellow)
2. Revenue Per Assigned Recipient (circled in blue)
Click 'DEMO' to continue.
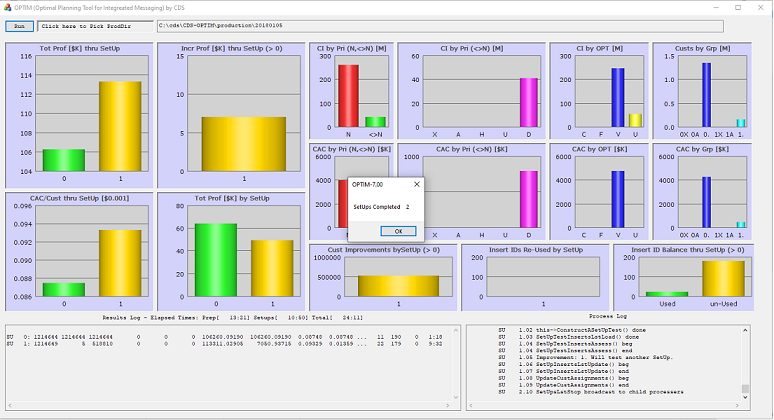
The rest of the demo is time-lapse of OPTIM iterations increasing profits by generating new combinations of inserts
that succesfully generate incremental net revenue in excess of setup up costs.
that succesfully generate incremental net revenue in excess of setup up costs.
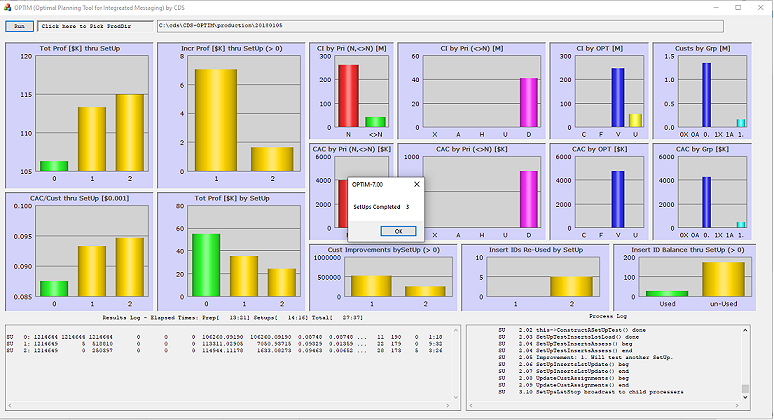
The rest of the demo is time-lapse of OPTIM iterations increasing profits by generating new combinations of inserts
that succesfully generate incremental net revenue in excess of setup up costs.
that succesfully generate incremental net revenue in excess of setup up costs.
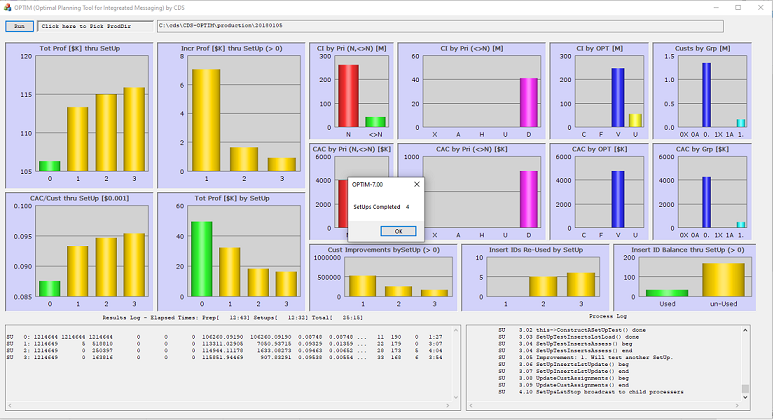
The rest of the demo is time-lapse of OPTIM iterations increasing profits by generating new combinations of inserts
that succesfully generate incremental net revenue in excess of setup up costs.
that succesfully generate incremental net revenue in excess of setup up costs.
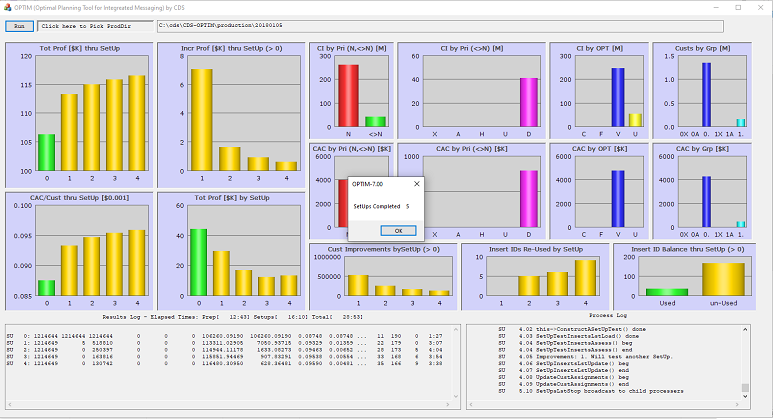
The rest of the demo is time-lapse of OPTIM iterations increasing profits by generating new combinations of inserts
that succesfully generate incremental net revenue in excess of setup up costs.
that succesfully generate incremental net revenue in excess of setup up costs.
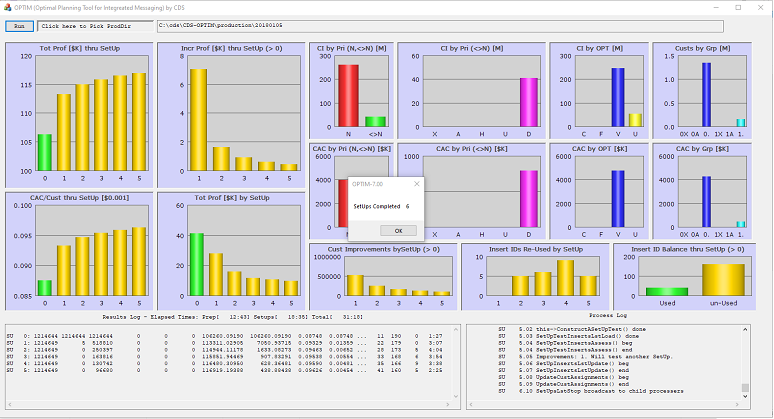
The rest of the demo is time-lapse of OPTIM iterations increasing profits by generating new combinations of inserts
that succesfully generate incremental net revenue in excess of setup up costs.
that succesfully generate incremental net revenue in excess of setup up costs.
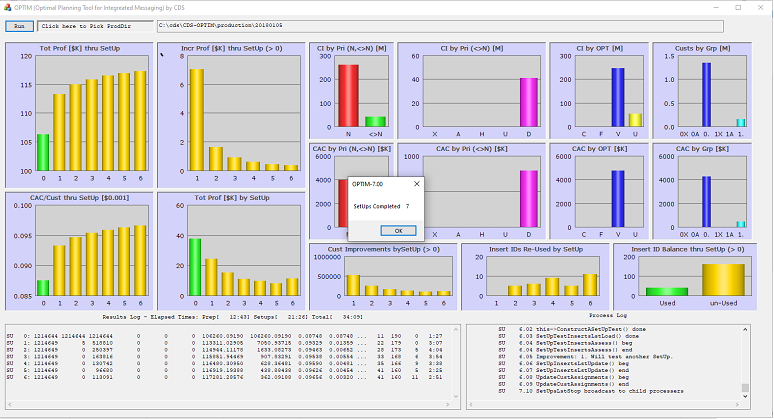
The rest of the demo is time-lapse of OPTIM iterations increasing profits by generating new combinations of inserts
that succesfully generate incremental net revenue in excess of setup up costs.
that succesfully generate incremental net revenue in excess of setup up costs.
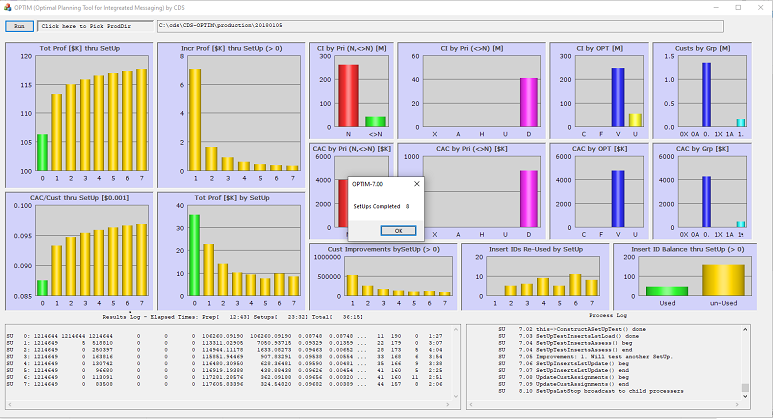
The rest of the demo is time-lapse of OPTIM iterations increasing profits by generating new combinations of inserts
that succesfully generate incremental net revenue in excess of setup up costs.
that succesfully generate incremental net revenue in excess of setup up costs.
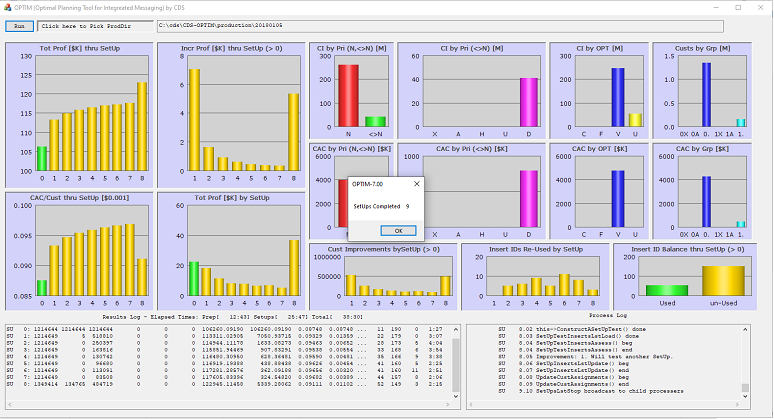
The rest of the demo is time-lapse of OPTIM iterations increasing profits by generating new combinations of inserts
that succesfully generate incremental net revenue in excess of setup up costs.
that succesfully generate incremental net revenue in excess of setup up costs.
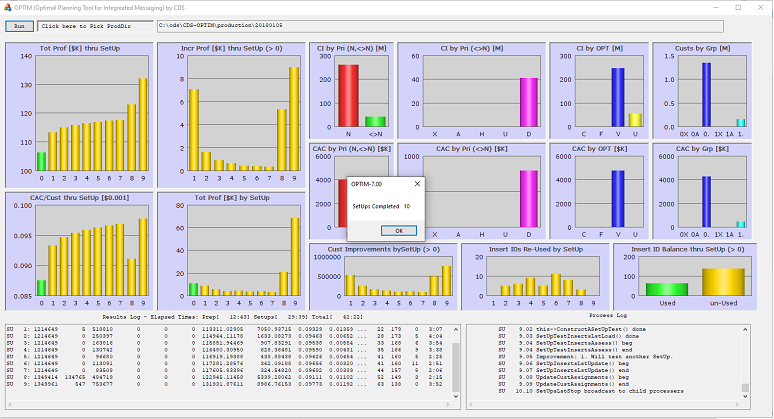
The rest of the demo is time-lapse of OPTIM iterations increasing profits by generating new combinations of inserts
that succesfully generate incremental net revenue in excess of setup up costs.
that succesfully generate incremental net revenue in excess of setup up costs.
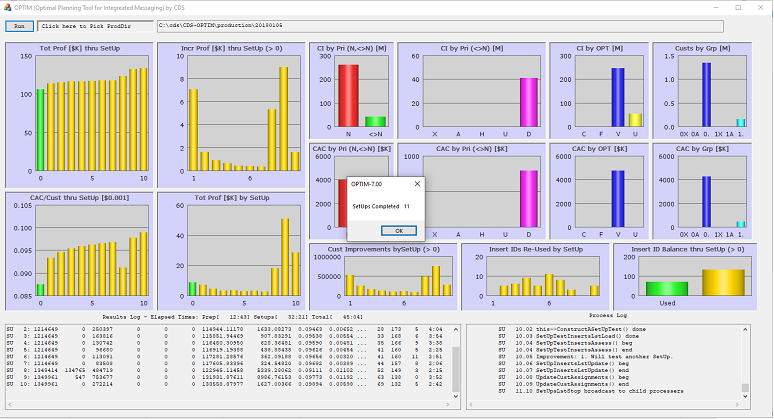
The rest of the demo is time-lapse of OPTIM iterations increasing profits by generating new combinations of inserts
that succesfully generate incremental net revenue in excess of setup up costs.
that succesfully generate incremental net revenue in excess of setup up costs.

The rest of the demo is time-lapse of OPTIM iterations increasing profits by generating new combinations of inserts
that succesfully generate incremental net revenue in excess of setup up costs.
that succesfully generate incremental net revenue in excess of setup up costs.
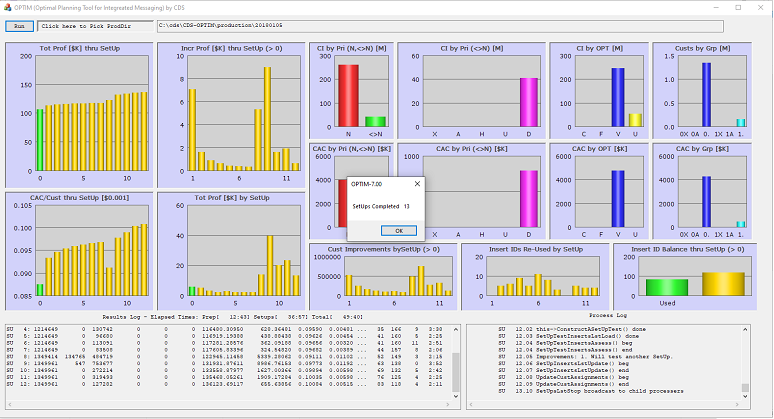
The rest of the demo is time-lapse of OPTIM iterations increasing profits by generating new combinations of inserts
that succesfully generate incremental net revenue in excess of setup up costs.
that succesfully generate incremental net revenue in excess of setup up costs.

The rest of the demo is time-lapse of OPTIM iterations increasing profits by generating new combinations of inserts
that succesfully generate incremental net revenue in excess of setup up costs.
that succesfully generate incremental net revenue in excess of setup up costs.
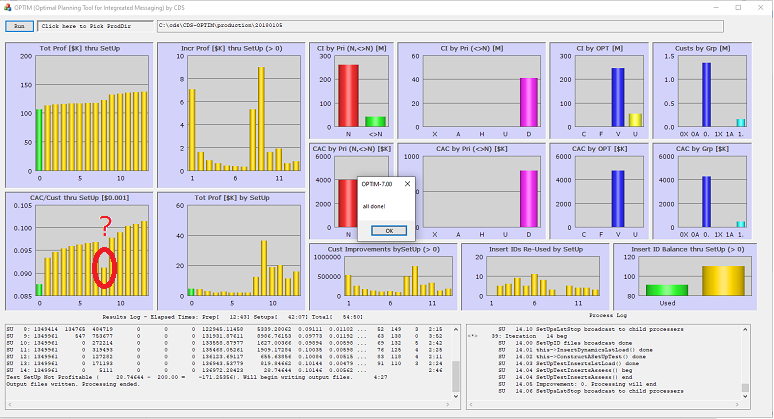
For economically justifiable set ups the upper left chart must always depict increased profit. Most test runs also
show rising revenue per Assigned Customer figures in chart just below the upper left chart. This interesting
exception is fully explained in 'Step Thru' mode and reveals some surprising capabilities of OPTIM.
show rising revenue per Assigned Customer figures in chart just below the upper left chart. This interesting
exception is fully explained in 'Step Thru' mode and reveals some surprising capabilities of OPTIM.

This page is only meant to refresh the viewer's memory as to how a Marketer provides OPTIM with a rich body
of information through 'Scored Files' that enables OPTIM to formulate, in a variety of ways, customer specific
offer prices for OPTIM to consider. OPTIM imports large numbers of these files to increase profit opportunities.
In this run, there were 1.5M recipients and 150 'Scored Files'. So there 225M possible assignment possibilities!

As a prepatory step, management decides which of the marketer inserts will be able to compete for inclusion in
recipient mail pieces for a daily producton run. 'Scored Files' are either placed in the 'ScoredFiles' directory and
eligible for inclusion or moved to the 'bullpen' directory and excluded from a run but available for possible future use.
recipient mail pieces for a daily producton run. 'Scored Files' are either placed in the 'ScoredFiles' directory and
eligible for inclusion or moved to the 'bullpen' directory and excluded from a run but available for possible future use.

A click on OPTIM's desktop icon launches the application wherein the user clicks upon the 'Directory Finder'
to search for a daily production directory to be processed.
to search for a daily production directory to be processed.

In this shot, the user has navigated to a daily production directory and is presented with the option of selecting it.
When he does, the OPTIM is ready for launch (next slide).
When he does, the OPTIM is ready for launch (next slide).

In this shot, the user has reached launch display and clicked 'RUN' to begin processing. The results of the first
iteration are shown. There are a number of real-time charts updated after every iteration but for now the demo
will only focus on the 2 charts in the upper left. These are:
1. Total Profit (circled in yellow)
2. Revenue Per Assigned Recipient (circled in blue)
iteration are shown. There are a number of real-time charts updated after every iteration but for now the demo
will only focus on the 2 charts in the upper left. These are:
1. Total Profit (circled in yellow)
2. Revenue Per Assigned Recipient (circled in blue)

The rest of the demo depicts OPTIM constructing test set ups generating incremental revenue in excess of set
up costs. The process repeats as long as incremental net revenue exceeds the setup charge. The revenue gains
are due to OPTIM repeatedly 'challenging' previous mail recipient insert assignments with new, net revenue
improving insert combinations that may replace any existing combinations with less revenue.

This is a run of the mill iteration result:
1. Total Profit (upper left chart) increases
2. Revenue Per Assigned Recipient (second upper left chart) increases
1. Total Profit (upper left chart) increases
2. Revenue Per Assigned Recipient (second upper left chart) increases

This is a run of the mill iteration result:
1. Total Profit (upper left chart) increases
2. Revenue Per Assigned Recipient (second upper left chart) increases
1. Total Profit (upper left chart) increases
2. Revenue Per Assigned Recipient (second upper left chart) increases

This is a run of the mill iteration result:
1. Total Profit (upper left chart) increases
2. Revenue Per Assigned Recipient (second upper left chart) increases
1. Total Profit (upper left chart) increases
2. Revenue Per Assigned Recipient (second upper left chart) increases

This is a run of the mill iteration result:
1. Total Profit (upper left chart) increases
2. Revenue Per Assigned Recipient (second upper left chart) increases
1. Total Profit (upper left chart) increases
2. Revenue Per Assigned Recipient (second upper left chart) increases

This is a run of the mill iteration result:
1. Total Profit (upper left chart) increases
2. Revenue Per Assigned Recipient (second upper left chart) increases
1. Total Profit (upper left chart) increases
2. Revenue Per Assigned Recipient (second upper left chart) increases

This is a run of the mill iteration result:
1. Total Profit (upper left chart) increases
2. Revenue Per Assigned Recipient (second upper left chart) increases
1. Total Profit (upper left chart) increases
2. Revenue Per Assigned Recipient (second upper left chart) increases

This is NOT a run of the mill iteration result:
1. Total Profit (upper left chart) increases BUT
2. Revenue Per Assigned Recipient (second upper left chart) decreases - why?
Answer: until now, a small mumber of recipients were only capabale of receiving 1 relatively light insert but OPTIM had only used
heavier inserts to this point! They were not counted as Assigned. Once OPTIM's search methodolgy used lighter inserts the # of
Assigned Recipients increased to the point the ratio of Revenue per Assigned Recipients decreased overall for this cycle.

This is a run of the mill iteration result:
1. Total Profit (upper left chart) increases
2. Revenue Per Assigned Recipient (second upper left chart) increases
1. Total Profit (upper left chart) increases
2. Revenue Per Assigned Recipient (second upper left chart) increases

This is a run of the mill iteration result:
1. Total Profit (upper left chart) increases
2. Revenue Per Assigned Recipient (second upper left chart) increases
1. Total Profit (upper left chart) increases
2. Revenue Per Assigned Recipient (second upper left chart) increases

This is a run of the mill iteration result:
1. Total Profit (upper left chart) increases
2. Revenue Per Assigned Recipient (second upper left chart) increases
1. Total Profit (upper left chart) increases
2. Revenue Per Assigned Recipient (second upper left chart) increases

This is a run of the mill iteration result:
1. Total Profit (upper left chart) increases
2. Revenue Per Assigned Recipient (second upper left chart) increases
1. Total Profit (upper left chart) increases
2. Revenue Per Assigned Recipient (second upper left chart) increases

This is a run of the mill iteration result:
1. Total Profit (upper left chart) increases
2. Revenue Per Assigned Recipient (second upper left chart) increases
1. Total Profit (upper left chart) increases
2. Revenue Per Assigned Recipient (second upper left chart) increases

Every profitable iteration must always show increased profit in the upper left chart. Most test runs also show increased
Revenue Per Assigned Recipient in the lower chart. The anomaly of decreased Revenue Per Assigned
Recipient was explained previously. But, it should be noted that the ability of OPTIM to find improvement
not immediately apparent demonstrates sophistication not shown by many other so called 'optimization' algorithms.
